Creates a ranking chart for a CEPALSTAT indicator belonging to the Sustainable Development Goals (SDG/ODS) dimension, using the latest available data by country.
Usage
ranking.sdg(
  id.indicator,
  language.en = TRUE,
  save = FALSE,
  file = NULL,
  format = c("png", "pdf", "svg"),
  height = 5,
  width = 9,
  size.title = 10,
  title = TRUE,
  caption = TRUE,
  color = "#0C4A61",
  color.gc = "#34B0AA",
  progress = TRUE
)
Arguments
- id.indicator
Numeric or character. Indicator ID.
- language.en
Logical. If
TRUE(default), English labels are used. IfFALSE, Spanish labels are used.- save
Logical. If
TRUE, saves the resulting figure.- file
Character. Output filename when
save = TRUE. IfNULL, the file is saved to a temporary directory usingtempdir().- format
Character. Output format when
save = TRUE. One of"png"(default),"pdf"or"svg".- height
Numeric. Height of saved figure.
- width
Numeric. Width of saved figure.
- size.title
Numeric. Title size.
- title
Logical. If
TRUE, displays the chart title.- caption
Logical. If
TRUE, displays a note indicating the latest available year by country.- color
Character. Color for countries in the ranking.
- color.gc
Character. Color for regional aggregates if present.
- progress
Logical. If
TRUE, shows progress messages during execution.
Examples
# \donttest{
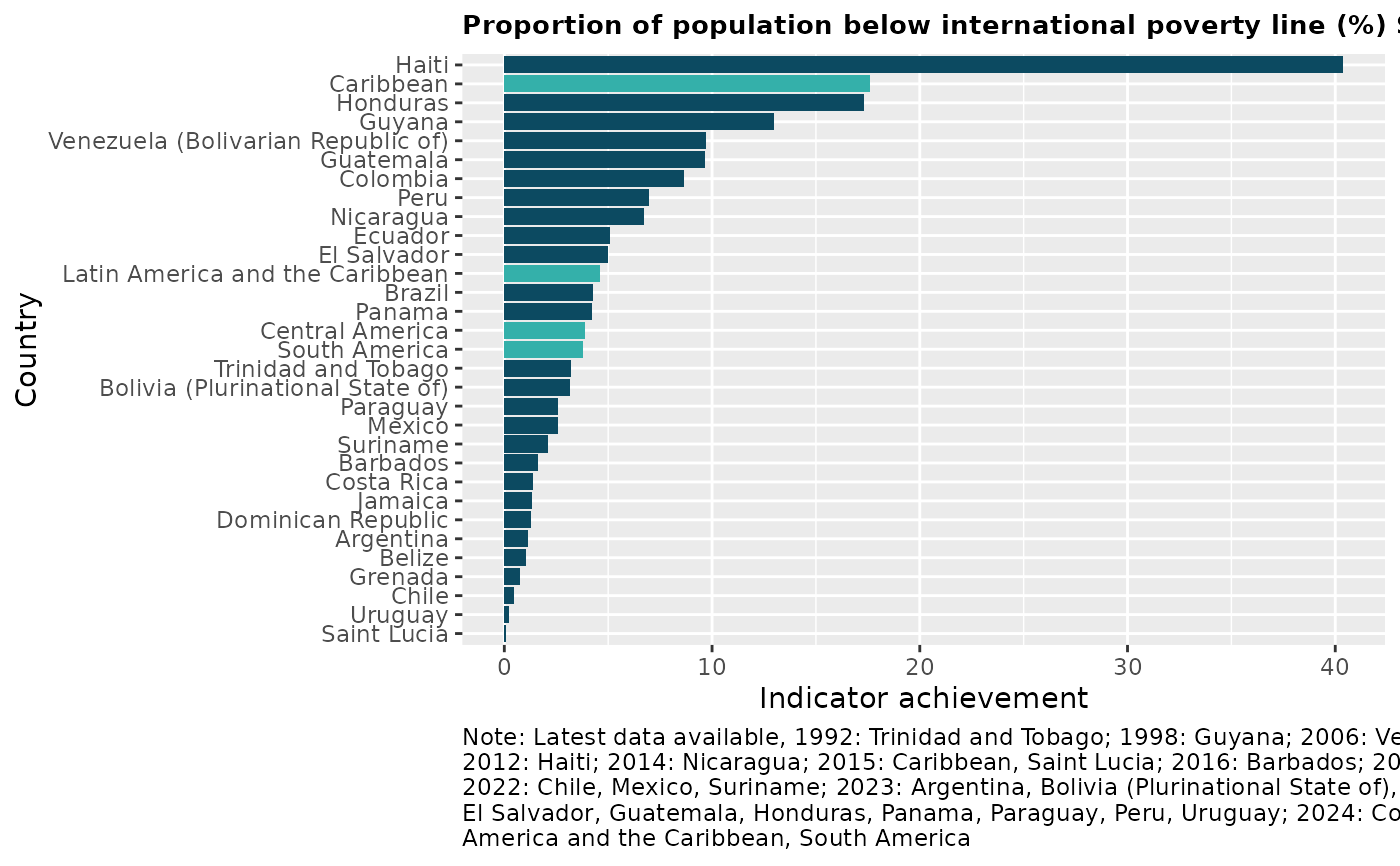
ranking.sdg(id.indicator = 3682)
#> Preparing SDG ranking...
#> Loading indicators metadata...
#> Downloading thematic tree from CEPALSTAT...
#> Parsing indicator hierarchy...
#> Finished downloading indicators.
#> Downloading indicator data...
#> Downloading indicator data from CEPALSTAT...
#> Indicator: Proportion of population below international poverty line (%) SI_POV_DAY1 (ID: 3682)
#> Assigning labels to dimension values...
#> Assigning variable names...
#> Finished download: Proportion of population below international poverty line (%) SI_POV_DAY1
#> Processing data...
#> Rendering plot...
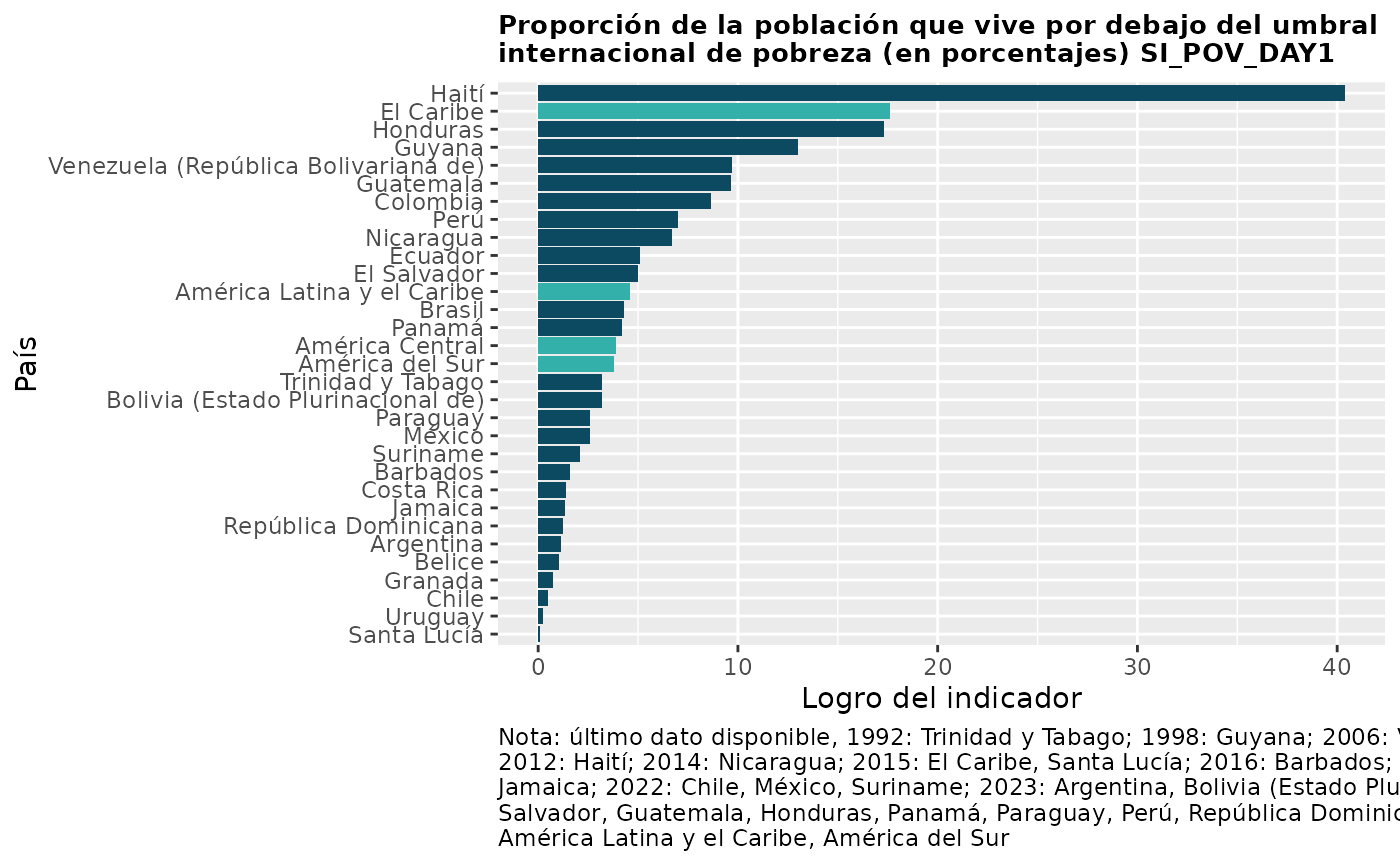
 ranking.sdg(id.indicator = 3682, language.en = FALSE)
#> Preparando ranking ODS...
#> Cargando metadatos de indicadores...
#> Descargando árbol temático desde CEPALSTAT...
#> Procesando jerarquía de indicadores...
#> Descarga de indicadores finalizada.
#> Descargando datos del indicador...
#> Descargando datos del indicador desde CEPALSTAT...
#> Indicador: Proporción de la población que vive por debajo del umbral internacional de pobreza (en porcentajes) SI_POV_DAY1 (ID: 3682)
#> Asignando etiquetas a los valores de las dimensiones...
#> Asignando nombres de variables...
#> Descarga finalizada: Proporción de la población que vive por debajo del umbral internacional de pobreza (en porcentajes) SI_POV_DAY1
#> Procesando datos...
#> Generando gráfico...
ranking.sdg(id.indicator = 3682, language.en = FALSE)
#> Preparando ranking ODS...
#> Cargando metadatos de indicadores...
#> Descargando árbol temático desde CEPALSTAT...
#> Procesando jerarquía de indicadores...
#> Descarga de indicadores finalizada.
#> Descargando datos del indicador...
#> Descargando datos del indicador desde CEPALSTAT...
#> Indicador: Proporción de la población que vive por debajo del umbral internacional de pobreza (en porcentajes) SI_POV_DAY1 (ID: 3682)
#> Asignando etiquetas a los valores de las dimensiones...
#> Asignando nombres de variables...
#> Descarga finalizada: Proporción de la población que vive por debajo del umbral internacional de pobreza (en porcentajes) SI_POV_DAY1
#> Procesando datos...
#> Generando gráfico...
 ranking.sdg(id.indicator = 3682,
save = TRUE,
file = file.path(tempdir(), "ranking_sdg.png"))
#> Preparing SDG ranking...
#> Loading indicators metadata...
#> Downloading thematic tree from CEPALSTAT...
#> Parsing indicator hierarchy...
#> Finished downloading indicators.
#> Downloading indicator data...
#> Downloading indicator data from CEPALSTAT...
#> Indicator: Proportion of population below international poverty line (%) SI_POV_DAY1 (ID: 3682)
#> Assigning labels to dimension values...
#> Assigning variable names...
#> Finished download: Proportion of population below international poverty line (%) SI_POV_DAY1
#> Processing data...
#> Rendering plot...
ranking.sdg(id.indicator = 3682,
save = TRUE,
file = file.path(tempdir(), "ranking_sdg.png"))
#> Preparing SDG ranking...
#> Loading indicators metadata...
#> Downloading thematic tree from CEPALSTAT...
#> Parsing indicator hierarchy...
#> Finished downloading indicators.
#> Downloading indicator data...
#> Downloading indicator data from CEPALSTAT...
#> Indicator: Proportion of population below international poverty line (%) SI_POV_DAY1 (ID: 3682)
#> Assigning labels to dimension values...
#> Assigning variable names...
#> Finished download: Proportion of population below international poverty line (%) SI_POV_DAY1
#> Processing data...
#> Rendering plot...
 #> Saving file...
ranking.sdg(id.indicator = 3682,
save = TRUE,
format = "pdf",
file = file.path(tempdir(), "ranking_sdg.pdf"))
#> Preparing SDG ranking...
#> Loading indicators metadata...
#> Downloading thematic tree from CEPALSTAT...
#> Parsing indicator hierarchy...
#> Finished downloading indicators.
#> Downloading indicator data...
#> Downloading indicator data from CEPALSTAT...
#> Indicator: Proportion of population below international poverty line (%) SI_POV_DAY1 (ID: 3682)
#> Assigning labels to dimension values...
#> Assigning variable names...
#> Finished download: Proportion of population below international poverty line (%) SI_POV_DAY1
#> Processing data...
#> Rendering plot...
#> Saving file...
ranking.sdg(id.indicator = 3682,
save = TRUE,
format = "pdf",
file = file.path(tempdir(), "ranking_sdg.pdf"))
#> Preparing SDG ranking...
#> Loading indicators metadata...
#> Downloading thematic tree from CEPALSTAT...
#> Parsing indicator hierarchy...
#> Finished downloading indicators.
#> Downloading indicator data...
#> Downloading indicator data from CEPALSTAT...
#> Indicator: Proportion of population below international poverty line (%) SI_POV_DAY1 (ID: 3682)
#> Assigning labels to dimension values...
#> Assigning variable names...
#> Finished download: Proportion of population below international poverty line (%) SI_POV_DAY1
#> Processing data...
#> Rendering plot...
 #> Saving file...
ranking.sdg(id.indicator = 3682,
save = TRUE,
format = "svg",
file = file.path(tempdir(), "ranking_sdg.svg"))
#> Preparing SDG ranking...
#> Loading indicators metadata...
#> Downloading thematic tree from CEPALSTAT...
#> Parsing indicator hierarchy...
#> Finished downloading indicators.
#> Downloading indicator data...
#> Downloading indicator data from CEPALSTAT...
#> Indicator: Proportion of population below international poverty line (%) SI_POV_DAY1 (ID: 3682)
#> Assigning labels to dimension values...
#> Assigning variable names...
#> Finished download: Proportion of population below international poverty line (%) SI_POV_DAY1
#> Processing data...
#> Rendering plot...
#> Saving file...
ranking.sdg(id.indicator = 3682,
save = TRUE,
format = "svg",
file = file.path(tempdir(), "ranking_sdg.svg"))
#> Preparing SDG ranking...
#> Loading indicators metadata...
#> Downloading thematic tree from CEPALSTAT...
#> Parsing indicator hierarchy...
#> Finished downloading indicators.
#> Downloading indicator data...
#> Downloading indicator data from CEPALSTAT...
#> Indicator: Proportion of population below international poverty line (%) SI_POV_DAY1 (ID: 3682)
#> Assigning labels to dimension values...
#> Assigning variable names...
#> Finished download: Proportion of population below international poverty line (%) SI_POV_DAY1
#> Processing data...
#> Rendering plot...
 #> Saving file...
# }
#> Saving file...
# }