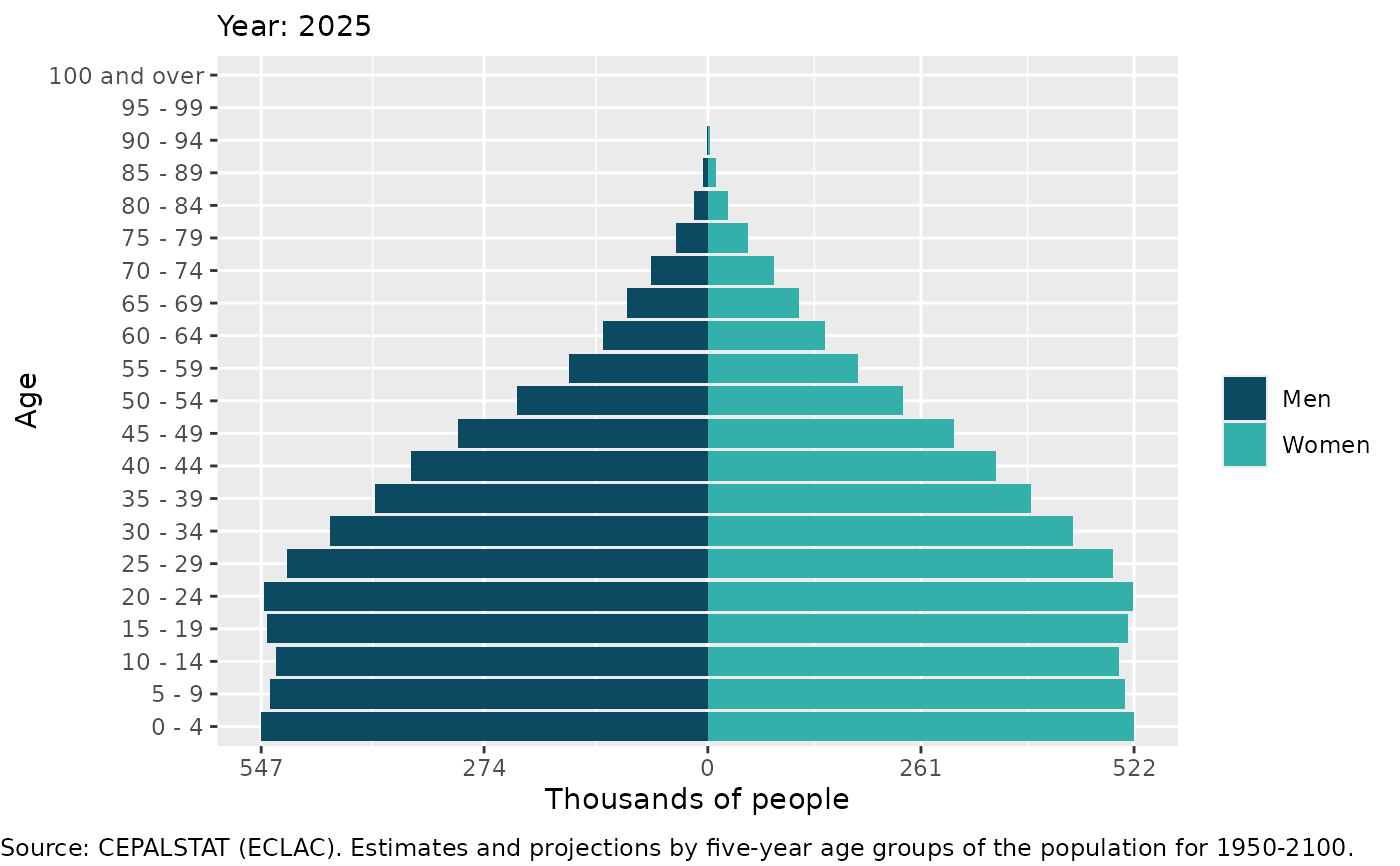
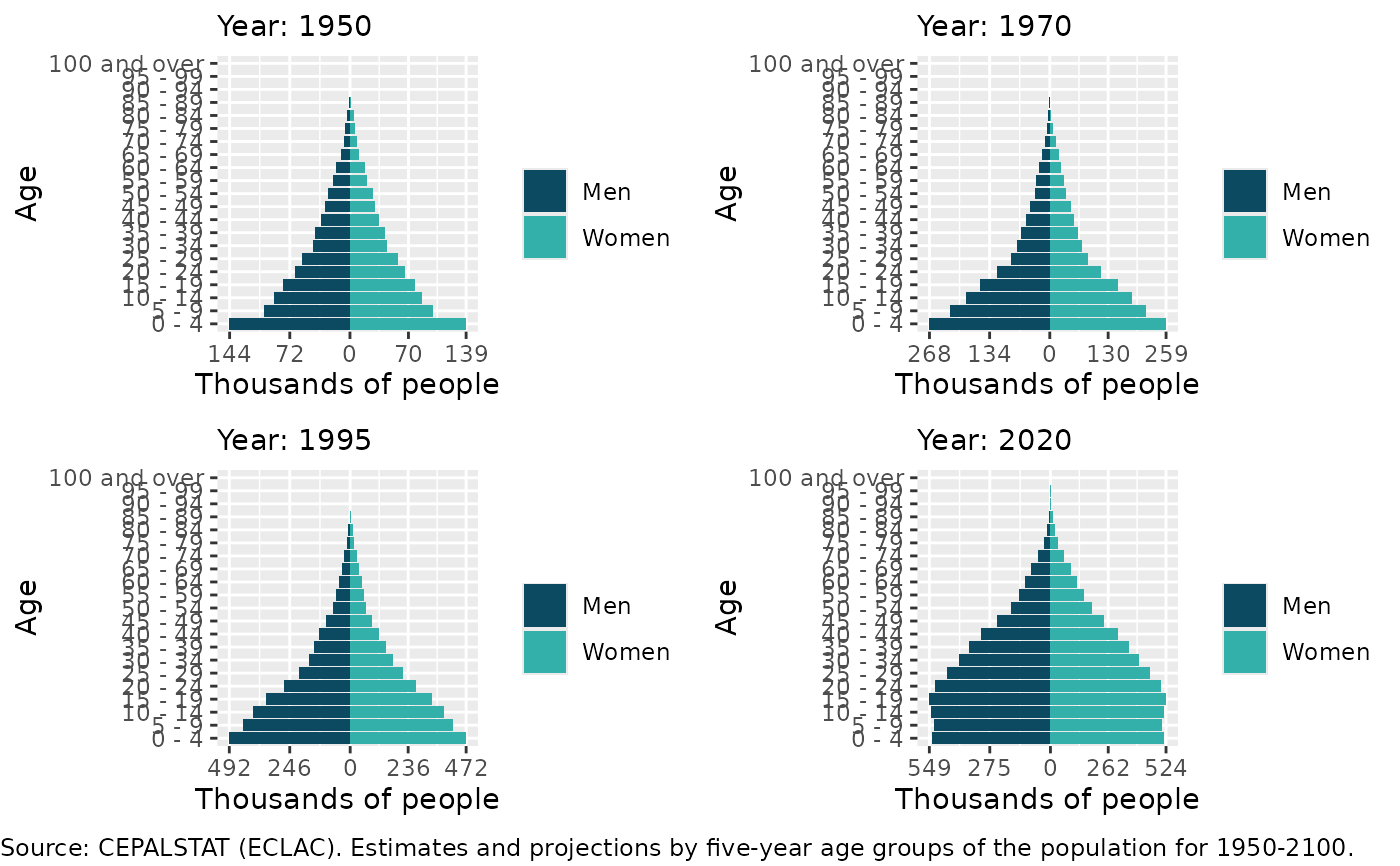
Creates one or multiple population pyramids for a selected country and years using CEPALSTAT population-by-age-and-sex data.
Arguments
- country
Character. Name of the country or region to plot.
- years
Numeric vector of positions between 1 and 31 corresponding to 5-year intervals from 1950 to 2100.
- language.en
Logical. If
TRUE(default), English labels are used. IfFALSE, Spanish labels are used.- color
Character vector of length 2 with colors for men and women.
- save
Logical. If
TRUE, saves the resulting figure.- file
Character. Output filename when
save = TRUE. IfNULL, the file is saved to a temporary directory usingtempdir().- format
Character. Output format when
save = TRUE. One of"png"(default),"pdf"or"svg".- height
Numeric. Height of saved figure.
- width
Numeric. Width of saved figure.
- caption
Logical. If
TRUE, adds a caption with source information.- progress
Logical. If
TRUE, progress messages are shown.
Value
Invisibly returns a grob object created by gridExtra::arrangeGrob().
Examples
# \donttest{
# Single year
pyramids(country = "Honduras", years = 16)
#> Preparing population pyramids...
#> Downloading indicator data from CEPALSTAT...
#> Indicator: Population, by age group and sex (ID: 31)
#> Assigning labels to dimension values...
#> Assigning variable names...
#> Finished download: Population, by age group and sex
#> Filtering and transforming data...
#> Creating plots...
 # Multiple years
pyramids(country = "Honduras", years = c(1, 5, 10, 15))
#> Preparing population pyramids...
#> Downloading indicator data from CEPALSTAT...
#> Indicator: Population, by age group and sex (ID: 31)
#> Assigning labels to dimension values...
#> Assigning variable names...
#> Finished download: Population, by age group and sex
#> Filtering and transforming data...
#> Creating plots...
# Multiple years
pyramids(country = "Honduras", years = c(1, 5, 10, 15))
#> Preparing population pyramids...
#> Downloading indicator data from CEPALSTAT...
#> Indicator: Population, by age group and sex (ID: 31)
#> Assigning labels to dimension values...
#> Assigning variable names...
#> Finished download: Population, by age group and sex
#> Filtering and transforming data...
#> Creating plots...
 #' # Save as PNG
pyramids(country = "Honduras",
years = c(1, 5, 10, 15),
save = TRUE,
file = file.path(tempdir(), "pyramids.png"))
#> Preparing population pyramids...
#> Downloading indicator data from CEPALSTAT...
#> Indicator: Population, by age group and sex (ID: 31)
#> Assigning labels to dimension values...
#> Assigning variable names...
#> Finished download: Population, by age group and sex
#> Filtering and transforming data...
#> Creating plots...
#' # Save as PNG
pyramids(country = "Honduras",
years = c(1, 5, 10, 15),
save = TRUE,
file = file.path(tempdir(), "pyramids.png"))
#> Preparing population pyramids...
#> Downloading indicator data from CEPALSTAT...
#> Indicator: Population, by age group and sex (ID: 31)
#> Assigning labels to dimension values...
#> Assigning variable names...
#> Finished download: Population, by age group and sex
#> Filtering and transforming data...
#> Creating plots...
 #> Saving output...
# Save as PDF
pyramids(country = "Honduras",
years = c(1, 5, 10, 15),
save = TRUE,
format = "pdf",
file = file.path(tempdir(), "pyramids.pdf"))
#> Preparing population pyramids...
#> Downloading indicator data from CEPALSTAT...
#> Indicator: Population, by age group and sex (ID: 31)
#> Assigning labels to dimension values...
#> Assigning variable names...
#> Finished download: Population, by age group and sex
#> Filtering and transforming data...
#> Creating plots...
#> Saving output...
# Save as PDF
pyramids(country = "Honduras",
years = c(1, 5, 10, 15),
save = TRUE,
format = "pdf",
file = file.path(tempdir(), "pyramids.pdf"))
#> Preparing population pyramids...
#> Downloading indicator data from CEPALSTAT...
#> Indicator: Population, by age group and sex (ID: 31)
#> Assigning labels to dimension values...
#> Assigning variable names...
#> Finished download: Population, by age group and sex
#> Filtering and transforming data...
#> Creating plots...
 #> Saving output...
# Save as SVG
pyramids(country = "Honduras",
years = c(1, 5, 10, 15),
save = TRUE,
format = "svg",
file = file.path(tempdir(), "pyramids.svg"))
#> Preparing population pyramids...
#> Downloading indicator data from CEPALSTAT...
#> Indicator: Population, by age group and sex (ID: 31)
#> Assigning labels to dimension values...
#> Assigning variable names...
#> Finished download: Population, by age group and sex
#> Filtering and transforming data...
#> Creating plots...
#> Saving output...
# Save as SVG
pyramids(country = "Honduras",
years = c(1, 5, 10, 15),
save = TRUE,
format = "svg",
file = file.path(tempdir(), "pyramids.svg"))
#> Preparing population pyramids...
#> Downloading indicator data from CEPALSTAT...
#> Indicator: Population, by age group and sex (ID: 31)
#> Assigning labels to dimension values...
#> Assigning variable names...
#> Finished download: Population, by age group and sex
#> Filtering and transforming data...
#> Creating plots...
 #> Saving output...
# }
#> Saving output...
# }